Tabular views (also called List Views or Decoded List) present the decoded data of signals in a column form. Tabular views can be created after defining any signal.
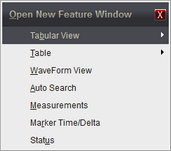
Tabular Views can be created by using the Feature Window button on the Top Toolbar, by using the local menu of a signal in Waveform Views or by using the Main Menu (Menu-> Window-> New-> Tabular View). Selections in the Main Menu and Feature Window lists are only available after creating a Signal Definition.
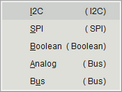
All signals, from Boolean and Bus to Protocol decoding or any Plug-in signal can be displayed in the List window. However, to see only the raw channel data of a Decoded signal in tabular format without any decoding, use a Table view instead. (see: Table Views)
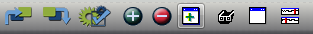
To create a new Tabular View, select the Open Feature Window button (highlighted above) from the main toolbar, then select the signal name from the Tabular View menu item. If you select a Boolean or Bus signal, a Table View will be created instead. Only the Signal Definitions you create for the project will be listed on the Tabular View.
|
|
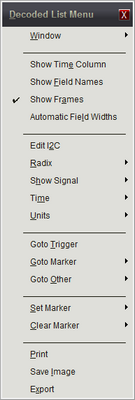
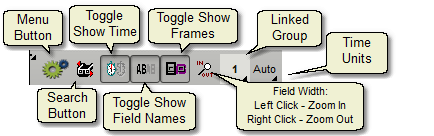
▪Multiple lists can be created and viewed simultaneously.
▪Time Display can be set to Auto, ns, us, ms, sec, min, hrs, days or weeks.
▪Time Format can be set to Delta or Absolute.
▪Time Column can be hidden.
▪Set, Clear or Jump to markers. (see Markers)
▪Assign Time Synchronized Link Group. (see: Using Link Groups)
▪Select which Signal to view in each List.
▪Edit Signal Properties. (see: Signal Editors)
▪Print current Tabular View or Save as JPEG. (see: Printing)
▪Export data using view's settings. (see: Exporting Lists)
▪The Radix can be set to Binary, Decimal, Hex, Octal or ASCII.
▪Field widths can be set for "Auto Size" (width is content based) or manually sized with a zoom button (equal width for all fields).
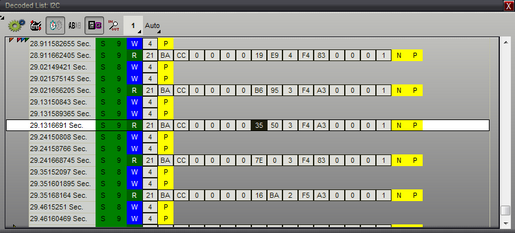
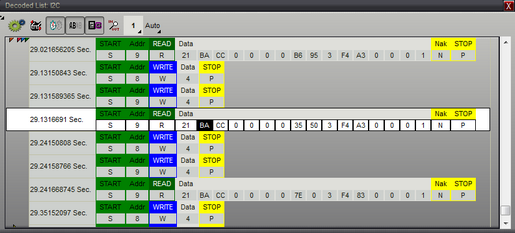
▪Selecting a field in a List will scroll all windows of the same Link Group to the field's start time and vise-versa (as shown above, the selected field is the darkened "35" in the center row.
▪Navigate and scroll using the Cursor Keys and Mouse Wheel.
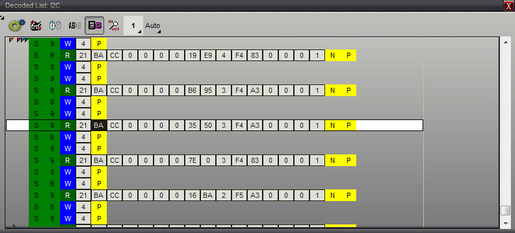
Tabular Views have several options to change what data to display and how the data is displayed. These options are accessible from the top bar in the window and can be used in combination. Some examples of the display options are shown below using an I2C signal.
Time Column:
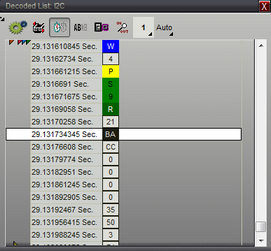
Time Column, Name:
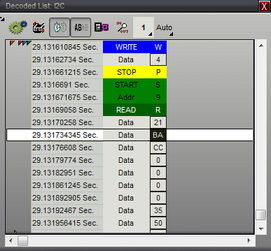
Time Column, Name, Frames:
Frames:
Menu: