Use the CAN BUS Signal type to decode the Controller Area Network protocol. This full featured decoder will decode the entire CAN 2.0B specification.
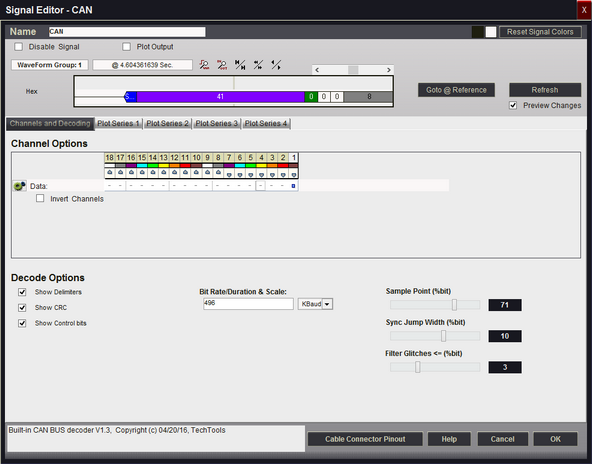
Signal Name
Change the text displayed here to help you identify this signal definition. If the name has already been used, it will automatically be appended with a numerical value in brackets (i.e. [2]). The name displayed here will be used in the Waveform Views, Searches, Tabular Views, Exports, Trigger Configurations and all menu references.
Disable Signal
Check this item to completely disable the Signal Definition. It is recommended to disable any signals that use channels that are not connected to a physical device. When a capture takes place ("Run"), any channels that are assigned to disabled signals will be ignored instead of using valuable capture space.
Plot Output
Check this item to enable Plotting for this signal. If checked, all waveform views will display plotted data as defined by the Plot Series configurations. You must enable and configure at least one Plot Series before any plotted data is visible. Up to 4 individual plots can be configured for each signal. (see: Plotting Signal Data).
Color Selection & Examples
An example of the signal is displayed in the current color scheme, followed by an example of the current color selections for this signal and a color reset button. Clicking on one of the color squares will open the Color Selection dialog to change the Signal line color and its background color if a color other than the theme color is desired.
Reset Signal Colors
This button will reset the colors for this signal so that they will match the currently selected color theme (see: Color Themes).
Channel Options
This is where you will associate a signal definition with the physical channels or connections to the outside world. Each signal definition type will have one or more channel selection groups and will allow one or more channels to be selected for each group. Each channel selection group will be identified on its left if more than one group is available for the signal type.
To select a channel, click on the " - " below the proper color (and channel number) that corresponds to the physical connection of the DigiView Cable (see: Connecting the Data Lines). Channels that are selected for this signal will replace the " - " with a blue square as shown above. The gray arrow beneath each channel color is an activity indicator that displays the activity of the channel as compared to the activity of all the other channels (relational, not real time).
Data Channel Selection
Selects which physical channel to assign to DATA.
Invert Channels
If selected, the captured data for DATA will be inverted before decoding and displaying (only affects this Signal Definition).
Show Delimiters
When selected, Delimiter fields will be visible in the output.
Show CRC
When selected, CRC fields will be visible in the output.
Show Control Bits
When selected, Control bits fields will be visible in the output.
Bit Rate/Duration & Scale:
Specify a value for the Bit Rate or the Bit Duration, then select a scale for the value entered. Scale selections include Nano seconds (ns), Micro seconds (us), Milli seconds (ms), Baud, KiloBaud (KBaud) and MegaBaud (MBaud). Note that the value must be an integer (no floating point.) To specify something with a decimal point, select the next lowest range and enter a whole number. For example, 115.2 KBaud would be entered as 115200 Baud and 12.31us would be entered as 12310ns.
Sample Point (%bit)
Specifies where we should sample the data within each bit cell as a percentage of the bit width. This defaults to mid-bit (50%) and can be adjusted to account for bus propagation delays, transceiver delays, bandwidth limitations, etc. This roughly corresponds to the combined settings of the SYNC_SEG, PROP_SEG and PHASE_SEG_1 mentioned in the CAN specification. Alternatively, it could be viewed as the total bit width - PHASE_SEG_2.
Sync Jump Width (%bit)
Specifies the percentage of a bit width to allow for resynchronization adjustments. This corresponds to the SJW parameter in the CAN specification.
The CAN specification allows for a wide tolerance on node oscillators. This is accomplished by requiring that nodes resynchronize on passive->dominate edges. The receivers compare the actual timing of these edges with the ideal timing at the specified baud rate and then make adjustments to their internal timers to resynchronize with the incoming data. This parameter specifies the maximum adjustment we will make when resynchronizing.
Increasing this number increases our ability to properly decode packets involving nodes with low accuracy oscillators at the expense of increased noise sensitivity. Lower numbers improve noise rejection but reduces our ability to work with nodes with low accuracy oscillators. You usually set this lower if all nodes use crystal oscillators for their baud rate reference, and higher if any of them use ceramic resonators or other low accuracy sources for their baud rate references.
Be aware that the (SAMPLE-POINT + SJW) should be less than 100% and that (SAMPLE-POINT - SJW) should be greater than 0.
Filter Glitches <= (%bit)
Specifies filtering of pulses that are less than or equal to the specified percentage of the Bit width.
DigiView has a much higher bandwidth than most CAN receivers so it is capable of capturing glitches or noise pulses that normal receivers might not even see. Also, many CAN receivers have different levels of filtering available. This option lets you tell us how relatively good we should be at rejecting noise pulses. A setting of 0 tells us to process full bandwidth data with poor rejection. Increasing this setting makes us simulate higher immunity parts. Selection range is from 0% to 10%.
Plot Series 1 - 4
If "Plot Output" is selected, up to 4 plots can be defined. If enabled and at least one Plot Series is defined, all waveform views will display the data in a plotted format. (see: Plotting Signal Data).